Review of Hsu et al.
(2014) on whale shark
HFM 30 Oct. 2014
Summary:
Publication is well done but I have reservation with regard to the analysis based on the growth functions chosen. Even if done correctly, it would NOT materially affect the results because the results for 3-parameter and 2-parameter VBGFs are so close.
I have reservations about the use of the Akaike Information Criteria corrected for sample size (AICc) in this paper. However, this goes beyond what was
attempted by the authors of this paper as they strictly used what was calculated by the SAS software. In the case of the
selection of the 2-VBGF over the 3-VBGF, I have an idea why AICc
selects the wrong growth curve. I
have no idea why the AICc gives such a high
probability to biannual band-pair formation over annual band formation or no
cycle. The latter two have basically ZERO probability compared to bi-annual
band-pair formation according to the AICc values,
whereas even the authors in the discussion say that annual band-pair formation
cannot be ruled out. I am not an expert on marginal
increment ratio (MIR) and centrum edge analysis (CEA) and let the
experts decide here.
1. Regarding growth curve analysis
Length vs. age should
be fitted with a 3-parameter VBGF, not a 2-parameter VBGF. Gompertz and
logistic function can also be considered, although I would not use a logistic
function. A 2-parameter is appropriate if only tag-recapture data is available.
In this the case the 3rd parameter of the VBGF (Lo) cannot be
determined.
The 3-parameter VBGF
for biannual, sexes combined has Lo = 0.504 m which is close to the
chosen value of 0.640 m for the 2-VBGF.
They chose the length of largest of the 324 embryos in the only pregnant
female captured. I suggest that Lo represents the mean length of all embryos
observed, not the one with the maximum size. The data set used included 3
embryos of lengths 0.548, 0.610, and 0.640 m TL. Mean size of these 3 is 0.599 m. The Lo of the 3-VBGF could be considered to be better represent the
mean length of the largest set of the 3 length classes observed in the ‘Young’
pregnant female.
As an aside and not applicable here, the range of size at birth for whale shark may be larger than what was observed for the one Taiwan pregnant female. According to Rowat & Brooks (2012): “Currently only 19 R. typus specimens of <1·5 m have been reported (Table I), most of which have been captured in fishing gear. Of note, an embryo of 94 cm LT was reported from India with an external yolk sac attached, indicating that it was not full term (Manojkumar, 2003), while in the Philippines a free swimming neonatal R. typus pup of 46 cm LT was found (Aca & Schmidt, 2011). This latter specimen had a freshly healed vitelline scar on its abdomen, where the yolk sac had been recently adsorbed into the body, indicating that it was a full-term embryo (Duncan & Holland, 2006; Hussey et al., 2010). These two findings suggest that R. typus pups may vary considerably in size at birth, compared to those found in the Taiwanese litter. The scarcity of these pups is a significant barrier to fully understanding the life history of R. typus and research into potential anatomical differences in these neonates may lead to the discovery of their habitat.”
According to the AICc values for biannual, sexes combined the 3-VBGF has a probability of only 0.231 compared to the 2-VBGF to minimize the information loss. [exp ((207.03-209.96)/2) = 0.231]. How can that be? I suggest the following: The AICc takes into account that the 2-VBGF has one parameter less and does not know that the third parameter (Lo) in the VBGF has been hand-picked. I suggest the following next step. Let us also hand-pick Loo (say 16 m) and redo the calculation and we might end up with an even more probable 1-VBGF fit. In conclusion I suggest that AICc is not appropriate to choose the 2-VBGF over the 3-VBGF. Putting it another way, the 2-VBGF should NOT have been used in the first place for length vs. age data.
The 3-parameter VBGF with Lo rather than tzero as the third parameter should be used for length vs. age data (Cailliet et al 2006). Lo has biological meaning, tzero has none. The SAS program may have used the VBGF with tzero as third parameter for mathematical reason but then Lo should be calculated and reported instead of tzero or at least in addition to tzero. The same applies to the Logistic and Gompertz when applied to shark length vs. age data. Hsu et al (2014) overrode the AICc best function in the case of female only data because the Logistic had unreasonably low Loo. Looking at calculated Lo would have shown that many cases considered in their Table 1 had unreasonably low or high Lo.
The female only data analysis also suggests that there is a problem with the AICc value criteria. They are all about the same but the one for the logistic would lowest (62.49). The symmetric logistic would be the last curve that I would consider suitable for age vs. length data. It is best for binomial data (zeros & ones). In this case it produces unreasonably low Loo (6.477). Hsu et al (2012) wisely ruled out the Logistic because of this. However, if it does not work in this case, and as explained above, it also does not work in the selection of 2-VBGF over the 3-VBGF, why would we consider that it works at all?
I also note that it is strange to have called the
well-known Logistic function the Robertson function. I’m not sure where that
came from, perhaps from the SAS program that was used to analyze the data. I
have not seen Robertson, T. B. (1923).
‘The Chemical Basis of Growth and Senescence.’ (JB Lippincott: Philadelphia,
PA.) It was first named in 1844-1845 by Pierre François Verhulst, long before Roberson.(1923).
The Gompertz curve, like the Logistic, never crosses the x-axis (as the VBGF does) but it is asymmetric and is much more suitable to analyze elasmobranch growth data than the Logistic. It allows for growth to be smaller for small sharks or rays (e.g. pups) whereas growth for the VBGF growth is always largest at birth (t=0).
I have updated my webpage at http://elasmollet.org/VBGF/VBGF.html as follows:
It is easier to
understand/discuss the VBGF using longevity (with units of time) instead of k
(with units of reciprocal time), despite the fact that longevity is rather ill-defined. It also better reflects the meaning of the
VBGF. According to Ricker (1979, p. 720) it was Taylor (1958) who proposed that
longevity should be defined as the time when L(t)
reaches 95% of Loo [L(t)/Loo = 0.95]. This could be considered to be the
lower limit although Taylor proposed it to be an upper age/longevity limit.
In the example above, for x = 0.95, we obtain t = (1/0.13863) ln[(3.0-0.5)/((1-0.95)3.0)]
= 20.3 years. The shark has reached 95% of Loo in 4.06 half-lives = 20.3
years.
Fabens (1965)
suggested that longevity should be defined as the time when L(t)
becomes larger than 99% [L(t)/Loo > 0.99, the exact value is 0.994383] with
associated time of 5/k (note that 5/k = 7.213 ln(2)/k).
In the example shown above this would be 36.065 yr
and could be considered to be the upper limit. The shark has reached 99.4%
of Loo in 7.213 half-lives = 36.1 years. Note that the upper limit
(Fabens) is almost twice as large as the lower limit (Taylor).
Importantly, k is not a growth rate, it is a rate constant with units of yr-1. See my page at http://elasmollet.org/VBGF/VBGF.html . I don’t think that the discussion of k values for different sharks in the Hsu et al (2014) paper is helpful.
Hsu et al (2012) did not correctly quote what Taylor (1958) and Fabens (1965) reported but in the end it does not matter because there is such a large range when calculating longevity from k. They reported 80.4 yr based on k = 0.037 yr-1 for 2VBGF using 95% of Loo as the criteria. A better value would have been based on k of the 3VBGF that would have produced 70.5 yr (from k = 0.042 yr-1).
The whale shark data collected by Hsu et al (2014) were juveniles only (one adult and three embryos/neonates). I suggest that no difference would be expected between males and females and that was as observed/reported. Additional juvenile data is not expected to change this. After all, male and female embryos/neonates have the same size at birth and growth rates are expected to be the same for juvenile males and females. Often adult males follow as similar growth rate than the juveniles whereas females do not. Females may experience a growth spurt as they mature (a discontinuity) and end up with a larger Loo compared to males. This is difficult to ‘catch’ with fitting routines as available growth data even if adult growth data is available because the growth variation between different individuals is so large.
2. AICc values
favoring biannual band-pair formation over annual band formation or no cycle by
a large margin
I’m quoting from the publication: “There was one peak in January and another possible one in June; however, sample sizes were low in February (n = 3), June (n = 4), August (n = 2), September (n = 3), and November (n = 1) (Fig. 6a). In addition, the AICc value of CEA (no cycle: 106.94; annual: 107.21; biannual: 88.79) indicated that the highest probability existed for biannual band pair formation (Fig. 6b). These results indicate that growth band pairs in these sharks formed biannually.”
I’m now looking at the probability differences based on AICc which are huge: Compared to biannual, the probability of no cycle is exp ((88.79-106.21)/2) = 0.000165; and compared to biannual, the probability for annual is exp ((88.79-107.21)/2) = 0.00010. I have a hard time understanding this. If my probabilities are correctly calculated (just took it from Wikipedia) then I wonder how suitable AICc is to determine which model is best. Sure Fig. 6 in the paper shows that a biannual is possible but even the authors are not completely sure that it is valid. They say in the discussion: “Although our results showed that a model of two band pairs per year had the highest probability, one band pair per year could not be completely ruled out because our sample size and range were limited.” However, according to AICs, the probability of the other options are basically ZERO.
3. Lack of giving confidences bands for the parameters reported in Table 1.
I also note that Table 1 does not give any confidence bands for the parameters Loo, k, and tzero. I suspect that some of these parameters are not significant. It is possible that it was only the linear regression that provided significant parameters for both slope and intercept.
4. Calculated growth
rates from 2VBGF.
Growth rates during the first year were estimated to be 0.60 m year-1 then declined gradually to 0.29 m year-1 by Year 20 based on the 2VBGF parameters (Table 2). Looks reasonable to me. The better 3VBGF would have given similar results (0.621 m/y and 0.280 m/y, respectively).
Rowan and Brooks (2012) commented as follows:
“Growth rates measured in aquarium kept R. typus showed neonatal pups grew faster than larger juveniles (Table II) (Chang et al., 1997; Leu et al., 1997). Juveniles >3·5 m LT showed variable rates with the females growing faster than males (Kitafuji & Yamamoto, 1998; Uchida et al., 2000). Growth rates in wild populations, based on estimated LT of live fish identified over several years, showed wide ranges (Table II) (Graham & Roberts, 2007; Riley et al., 2010) that are confounded by the associated error margins of these methods (±50 cm) (Holmberg et al., 2009). Wint- ner (2000), using the number of growth rings in the vertebral column compared to LT from 15 stranded R. typus specimens, estimated growth at the slower end of the aquarium-based growth rates (Table II).
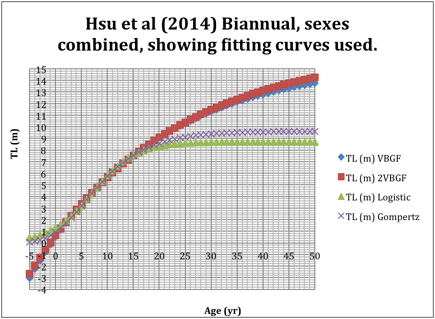
5. Graph of all four
growth functions for combined sexes, biannual band formation follows without
further discussion.
I don’t have the raw data which would be needed to find out what AICc is trying to do. I would prefer to first see what a least-square analysis would produce.